
The Probe Lifecycle
Choose how you want to drive the investigation:- Manual with VS Code
- Agentic with MCP
1
Set a Probe in VS Code
Right-click any line in an open source file and choose a probe type — Snapshot, Log, Counter, Metric, or Tic & Toc. The extension registers the probe definition with the broker.
2
SDK Agent Retrieves the Probe
The SDK agent polls the broker for active probes and dynamically instruments the target line in-memory. This happens live, with no process restarts.
3
Capture Runtime Data
When execution hits the instrumented line, the SDK agent captures variables, logs, counters, or metrics without stopping the application in a debugger.
4
Enqueue and Flush Telemetry
Captured telemetry is queued in a bounded in-memory buffer and flushed to the broker in asynchronous batches. Network I/O stays off the application request path.
5
Inspect Results in VS Code
The extension fetches the captured data and renders it inside your editor’s InSitu panel, presenting variable trees and call stacks.
Runtime Instrumentation Mechanics
InSitu does not modify your source files or your deployed build artifacts. Instead, it hooks into the runtime’s native introspection capabilities:- Node.js (V8): The Node SDK connects to the V8 debugger runtime using the native
inspectorprotocol. It places virtual break-hooks on specific compiled script locations. When hit, the callback grabs the local scope and call stack, returning control in microseconds. - Java (JVM): The Java Agent attaches via the standard
-javaagentflag. It performs lightweight, runtime bytecode manipulation using byte code libraries to inject capture instructions on-the-fly. - Python (CPython): Python 3.12 and later uses
sys.monitoring. Python 3.7–3.11 instruments selected function bytecode in memory. Both capture data on the application thread and enqueue telemetry for asynchronous delivery. Neither rewrites source files or usessys.settrace.
Architectural Topology
The VS Code extension and MCP-connected coding agents are two developer clients for the same InSitu backend. Both create probes through the broker and consume telemetry captured by the in-process SDK agent.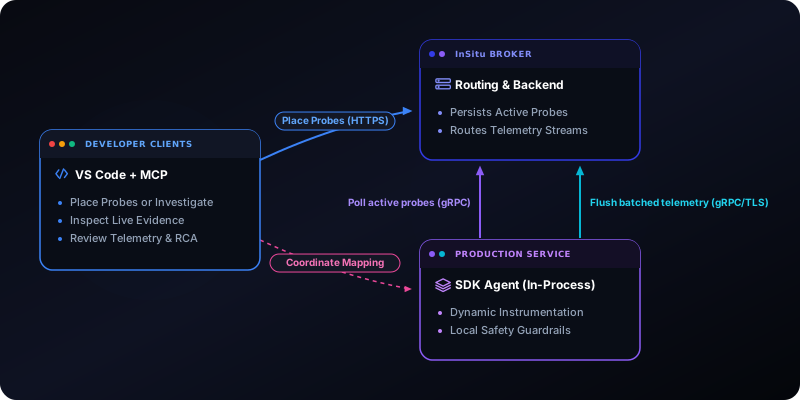
Built-In Safety Guardrails
The SDK agent runs a safety monitor alongside your host application to help limit resource contention and performance impact:- Overhead Suspension: Safety checks depend on the SDK. When a safety limit is crossed, the agent can suspend probes and resume them after a cooldown. See the Python SDK guide for Python thresholds.
- Global Throughput Throttling: Limits the maximum number of captures per second. Hits beyond this ceiling only increment the execution counter and bypass data serialization to save resources.
- Strict Payload Boundaries: Snapshots are restricted by maximum object depth, array length, and string size to ensure minimal memory usage.
- Local and Global Hit Limits: Each probe has a configurable hit limit. Once reached, its instrumentation is automatically and instantly uninstalled.